By Henry Adams, Maria-Veronica Ciocanel, Chad M. Topaz, and Lori Ziegelmeier
Can you recover a shape via a finite number of points sampled from it? How do you numerically find periodic orbits in a complex dynamical system? Is it possible to determine whether a collection of environmental sensors not equipped with GPS covers a specified region? These types of questions inspired the birth of applied and computational topology in the early 2000s [3, 5, 6].
Topology studies shape and space, with particular focus on properties of objects that are left unchanged by transformations such as stretching, shrinking, bending, and warping. For much of the 20th century, it lived squarely in the realm of pure mathematics. Typical advancements involved building up fundamental tools, classifying topological spaces, and studying manifolds and the behavior of functions on them. However, in recent years topology has become increasingly quantitative, computable, and statistical. Now crystalized as a field of its own, topological data analysis (TDA) describes rich classes of topological spaces that have multiple scales of resolution, are randomly generated, or vary in time. TDA continues to grow into new application domains like mathematical biology, materials science, signal processing, computer vision, computational linguistics, and economics.
Persistent Homology
Persistent homology is the workhorse of TDA. Homology relates to partially classifying the topology of objects and potentially determining the topological equivalence of two objects. Calculating an object’s Betti numbers can provide a great deal of homological information. The Betti number \(b_k\) calculates the number of holes with a \(k\)-dimensional boundary: \(b_0\) counts the number of connected components, \(b_1\) counts the number of flat holes, \(b_2\) counts the number of trapped volumes, and so on.
To understand the persistent part of persistent homology, we make a connection to data (see Figure 1). Suppose we have \(N\) data points in \(\mathbb{R}^m\). Furthermore, suppose \(N\) is large enough that it becomes necessary to summarize the data in some convenient way, yet imagine that we do not know a priori what about the data we would like to measure. One approach is to characterize the data through the lens of homology, i.e., by calculating its Betti numbers. But what does it mean for discrete data to have holes? To answer this question, we build a simplicial complex out of the data. We place an \(m\)-dimensional ball of diameter \(\varepsilon\) around each point—where \(\varepsilon\) is the persistence scale or proximity parameter—and then calculate the homology of the object formed. In fact, we do this for all \(\varepsilon \ge 0\), calculating the Betti numbers at every scale. This approach not only counts topological features, but equips each one with a length scale indicative of that feature’s geometry.
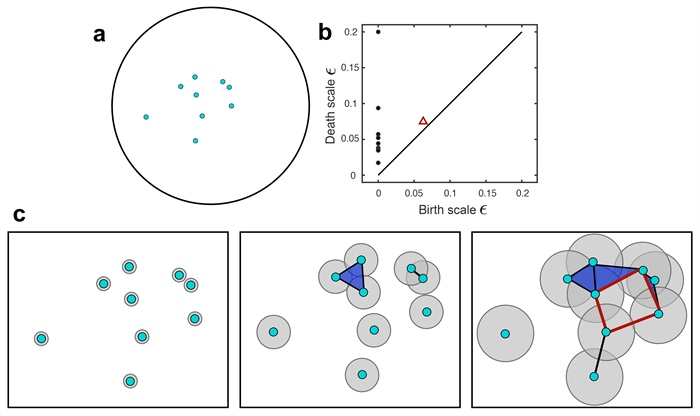
Figure 1. Pedagogical example of persistent homology computations. 1a. Initial locations of nine pea aphids in a circular domain, taken from a collective motion experiment [8] and analyzed in [10]. 1b. A persistence diagram summarizing the homology of the data in 1a across a range of persistence scales \(\varepsilon\). The horizontal and vertical axes respectively specify the values of \(\varepsilon\) at which a topological feature is born and dies. Black circles represent connected components and red triangles represent flat holes in the data. 1c. The Vietoris-Rips complexes of the data in 1a as the persistence scale \(\varepsilon\) takes on three increasing values. Each point is a 0-simplex and each edge is a 1-simplex, created if the \(\varepsilon/2\)-balls around two points intersect. Every triangle is a 2-simplex that forms if all vertices are pairwise connected by edges. Note the red quadrilateral in the last panel; because the four vertices are connected in a cyclic manner, there is a flat hole in the data. This hole manifests as the red triangle in 1b. Figure courtesy of Maria-Veronica Ciocanel.
Collective Motion, Agent-based Models, and Data Exploration
In biological aggregations such as bird flocks, fish schools, and insect swarms, organisms interact via forces like social attraction, repulsion, and alignment. These interactions dictate the movement of individuals, and the many individual movement decisions may result in collective motion of the group. Self-organized collective motion can include vortex-like mills, ring structures, and strongly-aligned flocking groups. Agent-based models help elucidate the relationship between individual movement choices and large-scale group behavior [4, 11].
Biological aggregations can generate massive amounts of data, thus requiring tools that summarize the dynamic information arising from experimental observations or model simulations. As a thought experiment, consider the recording and imaging of 2,600 starlings during a flocking event [1]. The imaging technique provides the three-dimensional position and velocity of each bird in every video frame, recorded at 10 frames per second. Just one minute of video for a field observation creates 107 pieces of information. Flocking events called murmurations can last for minutes or hours; the latter could produce 109 pieces of information. Data analysis is essential to the study of phenomena that are not easily detectable by the human eye.
A topological approach to collective motion data encodes the Betti number \(b_k\) as a function of the scale parameter \(\varepsilon\) for a given homology dimension \(k\) and a static set of points [9]. Repeating this process for each moment in time creates a two-variable function \(b_k (t, \varepsilon)\) that provides a topological signature of time-varying data across scales. If values of \(t\) and \(\varepsilon\) are selected on a grid, we can represent the Betti numbers as a matrix and visualize them as a contour plot called a CROCKER (Contour Realization of Computed \(k\)-dimensional hole Evolution in the Rips complex). Exploration of CROCKERs arising from the simulations of agent-based models (such as those in [4, 11]) detects phenomena that are not easily visible or noticed by commonly-used order parameters like group polarization. These phenomena include intermittent clustering of agents, lone agents, unoccupied regions of the simulation domain, and double mills comprising two superposed counter-rotating groups.
Model Selection
Biologists and mathematical biologists routinely face the challenge of model selection, i.e., choosing between several mathematical models that may describe a given dataset. TDA can help address this challenge. One example involves pea aphids filmed walking in an experimental arena (see Figure 1a) [8]. Researchers fed their video data into motion tracking software to obtain the coordinates of each insect during every frame. They then introduced the following modeling framework. Each aphid transitions stochastically between a moving and stationary state. Moving aphids perform an unbiased correlated random walk, which incorporates a randomly drawn step length and turning angle. A key biological question is whether the aphids interact socially. To address this query, the researchers proposed two versions of their model. The interactive model incorporates social interactions via the model parameters’ dependence on distance to an aphid’s nearest neighbor, while the control model ignores social interactions and uses fixed (optimized) constants for these parameters.
Which model is more faithful to the experimental data? One study adopted three approaches to answer this question [10]. The first method utilized order parameters traditionally studied in collective motion, such as group polarization and angular momentum. For these traditional order parameters, scientists compared simulated order parameter time series to experimental ones and chose the model with the statistically closer time series. Though similar to the first, the second strategy instead used order parameters that are closely related to model inputs, such as average distance from an aphid to its nearest neighbor. Because these parameters reflect a priori knowledge of the model, they are called a priori order parameters. The third method was again similar, but employed topological summaries of the data, namely CROCKERs.
While traditional order parameters offer a mixed message about model preference, a priori order parameters consistently indicate that the interactive model is closer to experimental data than the control model [10]. The topological approach also suggests that the interactive model is more consistent with experimental data. Given that CROCKERs do not use any a priori knowledge about the datasets or the models that generate them, the topological approach could be useful for describing and comparing collective motion when little is known about key model mechanisms.
Parameter Inference
Mathematical biologists are also interested in parameter inference — that is, deducing appropriate model parameters from an observed dataset. Scientists applied topological data analysis and machine learning [2] to the model in [4]. By nondimensionalizing the model and fixing both the number of agents and the parameters that describe self-propulsion and drag, one can reduce the model to a two-dimensional space of parameters: the ratio of the characteristic strengths of attraction and repulsion, and the ratio of their distinctive length scales. Depending on the parameters, the model might produce collective behaviors including single mills, double mills, disorganized swarms, and group dispersal.
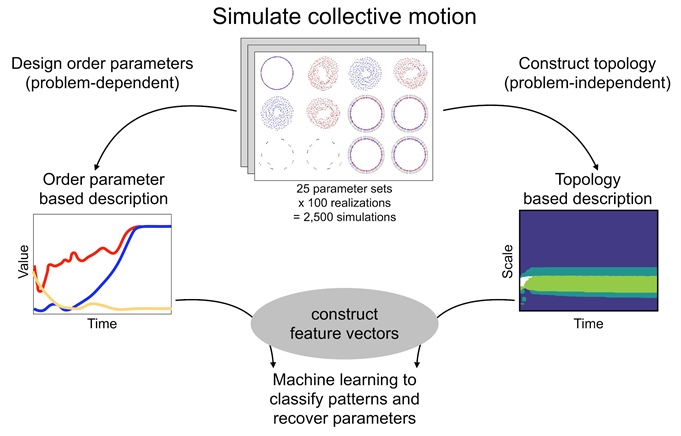
Figure 2. Analysis pipeline [2] for recovering parameters and inferring collective motion phenotypes from data produced by simulations of an influential model of collective motion [4]. In this pipeline, one simulates the model many times and constructs a feature vector for each simulation. The feature vectors serve as input to machine learning algorithms, which identify parameters and the type of collective motion. Feature vectors arising from order parameter time series are traditionally used in studies of collective motion, such as group polarization or angular momentum. In contrast, one can utilize feature vectors that originate from topological data. Topological features yield far more accurate results than traditional features, even though they do not require contextual knowledge about model phenomena [2]. Researchers explore the limit of very low-dimensional features and attain 93.1 percent supervised classification accuracy using topological feature vectors reduced to three dimensions via principal component analysis (PCA) [2]. In contrast, three-dimensional feature vectors computed via PCA on group polarization and angular momentum achieve 46.7 percent and 30.0 percent accuracy respectively. Figure courtesy of Angelika Manhart and adapted from [2].
Researchers have developed a TDA-based method for parameter recovery in this system (see Figure 2) by generating a large library of model simulations and systematically varying the two model parameters [2]. Each simulation transforms into a feature vector that summarizes the dynamics. One class of feature vectors comprises the aforementioned traditional order parameters. A second class contains vectorized CROCKER data: \(b_0\), \(b_1\), or the concatenation of both. One can calculate these CROCKERs from agent position or augment them with time-delayed position data to incorporate information about velocity. For every simulation, feeding each feature vector into machine learning algorithms recovers parameters and identifies a phenotypic pattern. In both supervised and unsupervised machine learning approaches, topological features give rise to far more accurate results than traditional ones, even though they do not require contextual knowledge about model phenomena (see Figure 2).
Concluding Perspectives
Persistent homology measures both a dataset’s global topology and its local geometry. By using CROCKER data (or more sophisticated invariants [7]) in concert with simple data visualization, statistical tests, and machine learning techniques, we can possibly detect important events in dynamical data, choose between potential data models, and even recover parameters. These approaches have aided our understanding of collective motion in biological aggregations and may provide similar benefits in other areas of mathematical biology.
Chad M. Topaz presented this research during an invited talk at the 2019 SIAM Conference on Applications of Dynamical Systems, which took place last spring in Snowbird, Utah. His presentation is available from SIAM either as slides with synchronized audio or as a PDF of slides only.
References
[1] Ballerini, M., Calbibbo, N., Candeleir, R., Cavagna, A., Cisbani, E., Giardina, I., …, Zdravkovic, V. (2008). Interaction ruling animal collective behavior depends on topological rather than metric distance: Evidence from a field study. Proc. Natl. Acad. Sci., 105(4), 1232-1237.
[2] Bhaskar, D., Manhart, A., Milzman, J., Nardini, J.T., Storey, K., Topaz, C.M., & Ziegelmeier, L. (2019). Analyzing collective motion with machine learning and topology. Chaos, 29(12), 123125.
[3] Carlsson, G. (2009). Topology and data. Bull. Amer. Math. Soc., 46(2), 255-308.
[4] D’Orsogna, M.R., Chuang, Y.-L., Bertozzi, A.L., & Chayes, L.S. (2006). Self-propelled particles with soft-core interactions: Patterns, stability, and collapse. Phys. Rev. Lett., 96(10), 104302.
[5] Edelsbrunner, H., & Harer, J. (2010). Computational Topology: An Introduction. Providence, RI: American Mathematical Society.
[6] Edelsbrunner, H., Letscher, D., & Zomorodian, A. (2002). Topological persistence and simplification. Disc. Comp. Geom., 28, 511-533.
[7] Kim, W., & Mémoli, F. (2019). Spatio-temporal persistent homology for dynamic metric spaces. Preprint: arXiv:1812.00949.
[8] Nilsen, C., Paige, J., Warner, O., Mayhew, B., Sutley, R., Lam, M., …, Topaz, C.M. (2013). Social aggregation in pea aphids: Experiment and random walk modeling. PLOS One, 8(12), e83343.
[9] Topaz, C.M., Ziegelmeier, L., & Halverson, T. (2015). Topological data analysis of biological aggregation models. PLOS One, 10(5), e0126383.
[10] Ulmer, M., Ziegelmeier, L., & Topaz, C.M. (2019). A topological approach to selecting models of biological experiments. PLOS One, 14(3), e0213679.
[11] Vicsek, T., Czirók, A., Ben-Jacob, E., Cohen, I., & Shochet, O. (1995). Novel type of phase transition in a system of self-driven particles. Phys. Rev. Lett., 75(6), 1226-1229.
Henry Adams is a topologist and professor of mathematics at Colorado State University. He is also the co-director of the Applied Algebraic Topology Research Network. Maria-Veronica Ciocanel is an applied mathematician at the Mathematical Biosciences Institute. She is also a President’s Postdoctoral Scholar at The Ohio State University. Chad M. Topaz is an applied mathematician, data scientist, and professor of mathematics at Williams College. He is also the co-founder and director of the Institute for the Quantitative Study of Inclusion, Diversity, and Equity. Lori Ziegelmeier is an associate professor of mathematics at Macalester College. Her research interests are in geometric and topological data analysis, and she is a founder and steering committee member of Women in Computational Topology.