By Peter Grindrod, Desmond J. Higham, and Peter Laflin
Last year, two of us (PG and DJH) contributed to a two-part article in SIAM News about the growth of social network analysis in business and government [5]. Joined in the present article by Peter Laflin, head of Data Insight at the UK-based digital marketing agency Bloom [1], we describe some developments that followed directly from the SIAM News article.
Bloom clients typically wish to monitor and improve their online social media presence. The SIAM News article alerted Bloom’s Insight team to a discussion of time-dependent networks in [4]. The matrix-based algorithms described there proved to be useful for identifying key players in the large-scale online conversations taking place on topics of interest to Bloom clients. Following this initial success, Bloom made a good old-fashioned telephone call, which has led to the mutually beneficial collaboration briefly reported here. On the academic side, researchers at the Universities of Reading and Strathclyde have advised on cutting-edge developments; Bloom’s role has been to provide examples of large data sets, along with some current and future challenges [6].
As an example of knowledge exchange driving new research, our collaboration on a Twitter data set [8,9] flagged the need to identify and categorize spam accounts that generate automated Tweets. That case study also provided the university researchers with a rare benchmarking opportunity—Twitter accounts deemed influential by the computational algorithms could be compared with those picked out from the same data set by a team of social-media experts with day-to-day experience in hand-curating this type of information. Our study found the best computational measures to be essentially indistinguishable from the selections made by human experts.
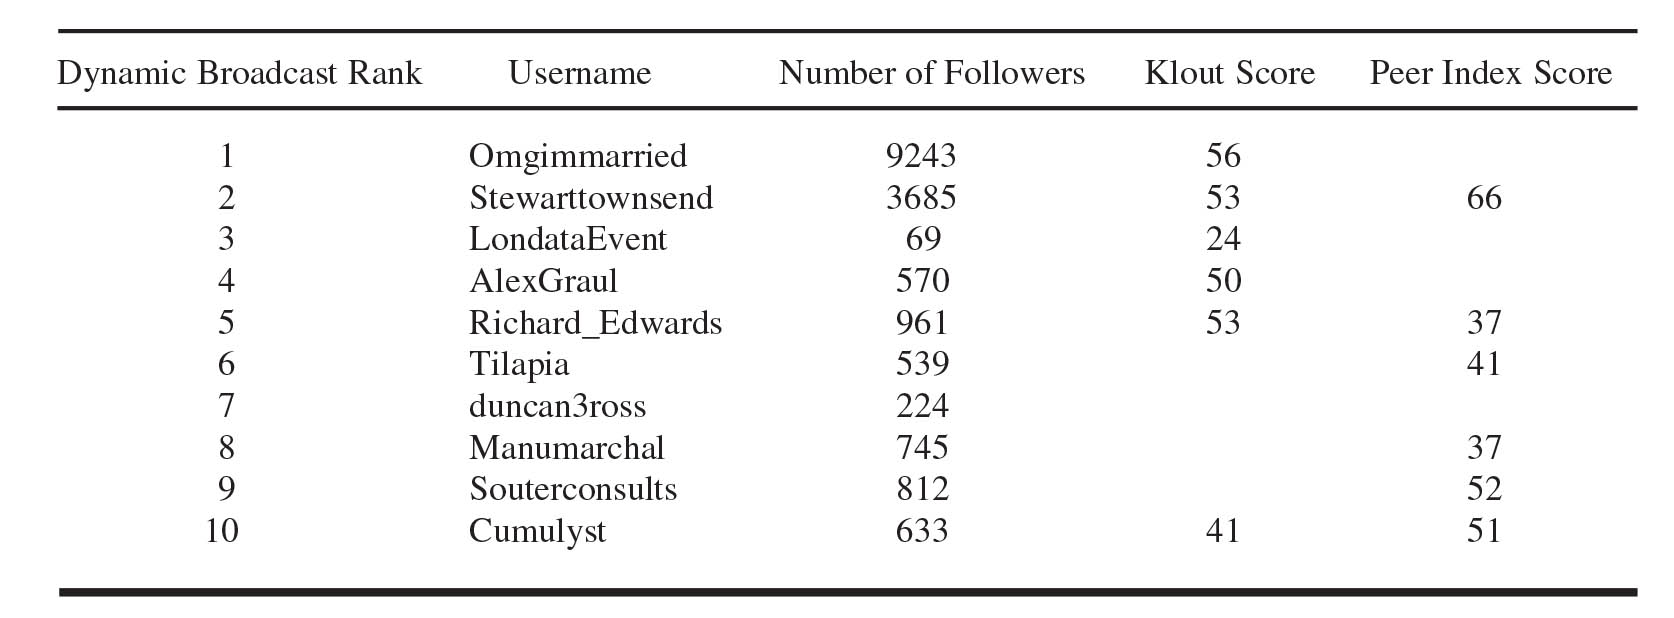
Table 1. The ten most influential attendees who registered for Londata as ranked by their dynamic broadcast score [4], and some other measures of their influence.
|
This fall, Bloom presented an overview of its work at Londata, a regular “big data” event in London. Before the talk, the team ran a preprocessing step in which it assessed the influence of the people who had registered for the event, based on their Twitter footprints. The ten most influential attendees, ranked in terms of their “dynamic broadcast” score from [4], are shown in Table 1. Where available, the table also shows some other measures of influence: number of followers for each account, Klout score [7], and Peer Index score [10].
Figure 1. A snapshot of part of the interaction network during the recording and analysis of 290 Tweets made during a presentation at Londata. The visualisation reveals distinct communities involved in the Londata conversation and highlights influential Twitter accounts.
This initial analysis wasn’t conversation-specific: It simply took the 150 people registered for Londata and considered how readily messages could flow between them. The @LondataEvent account is of interest here; its third-place ranking, in our opinion, shows the account to be highly influential. It has a small following, but those people typically amplify messages received from @LondataEvent. This indicates that the dynamic broadcast measure of influence goes far deeper than a simple counting of followers. The measure can also be applied in real time, so the Insight team—at the risk of disappearing into an infinitely recursive puff of smoke—used its analytical tools to calculate influence and visualise the interactions by listening to Twitter activity during the course of Bloom’s own presentation on the topic. The team thus recorded and analysed the 290 Tweets made by participants (the audience was made up of digitally savvy types!), updating the influence scores every 5 minutes. Figure 1 shows a snapshot of part of the interaction network during its evolution. This visualisation reveals distinct communities involved in the LonData conversation and highlights the influential Twitter accounts.
Figure 2. A graph of the peaks and valleys of sentiment during presentations at a Londata event in London.
Tweets can be rated negatively or positively for “sentiment,” and Bloom used its tools to construct a weighted sentiment score that summarizes current feeling on a topic. Alex Craven, the Bloom CEO, began the Londata presentation at 18:20 hours. As shown in Figure 2, his introduction was welcomed with a burst of positive sentiment.
The subsequent drop was caused by Peter Laflin’s discussion of the three V’s of big data (volume, velocity, and variety); people in the audience perhaps wondered whether the talk would have any new and interesting content. The biggest spike of sentiment, at around 20:00, coincided with Bloom’s explanation of how the agency’s tools successfully predicted that Sweden would win the 2012 Eurovision Song Contest [2], based on Twitter activity during the semifinal shows. The two further peaks in the graph correspond to discussion about the identification of spam accounts.
Table 2. The influence rankings of the top ten at the end of a Londata talk this fall.
The influence ranking of the top ten Twitter accounts at the end of the talk is shown in Table 2, in order of dynamic broadcast score. (Number of followers, Klout score, and Peer Index score, which are not topic-specific and do not change over this timescale, are the same as given in Table 1.)
Although the matrix algorithms underlying Bloom’s tools arose in academia, and hence are in the public domain [3,4], making them work in the online social media setting involves extra levels of know-how; in particular, creating suitable networks from what can be huge amounts of time-stamped interactions is a key step. The first generation of social media monitoring tools, such as Klout and PeerIndex, judge who is “likely” to influence, whereas Bloom’s “big data” approach is to listen to topic-based conversations in real time and measure who is actually influencing. Just as large-scale matrix computations brought order to the web in the guise of Google’s PageRank algorithm, they now offer the potential to tame the Twittersphere.
References
[1] Bloom Agency, www.bloomagency.co.uk/.
[2] Eurovision Song Contest 2012, http://www.eurovision.tv/page/baku-2012/about/shows/final.
[3] P. Grindrod and D.J. Higham, A matrix iteration for dynamic network summaries, SIAM Rev. (Research Spotlights), to appear.
[4] P. Grindrod, D.J. Higham, M.C. Parsons, and E. Estrada, Communicability across evolving networks, Phys. Rev. E, 83:4 (2011), 046120.
[5] D.J. Higham, P. Grindrod, and E. Estrada, People Who Read this Article Also Read . . . , Parts I and II, SIAM News, 44:1 and 2 (2011).
[6] Impact: When Mathematics Meets Digital Media Marketing (Abridged Version), http://www.youtube.com/watch?v=l8QH-Woa9bI.
[7] Klout, http://klout.com/home.
[8] P. Laflin, A.V. Mantzaris, F. Ainley, A. Otley, P. Grindrod, and D.J. Higham, Dynamic targeting in an online social medium, Mathematics and Statistics Report 16, University of Strathclyde, 2012, Proceedings of the 4th International Conference on Social Informatics, Lausanne, Switzerland, to appear.
[9] P. Laflin, A.V. Mantzaris, D.J. Higham, P. Grindrod, F. Ainley, and A. Otley, Twitter’s big hitters, Proceedings of 2012 Digital Economy All Hands Conference, Aberdeen, Scotland, to appear.
[10] PeerIndex, http://www.peerindex.com/.
Peter Grindrod is a professor in the Department of Mathematics and Statistics at the University of Reading, UK. Desmond J. Higham is a professor in the Department of Mathematics and Statistics at the University of Strathclyde, UK. Peter Laflin is head of Data Insight at the Bloom Agency in Leeds, UK.