Leading Eigenvalues and the Spread of Cholera
By Marino Gatto, Lorenzo Mari, and Andrea Rinaldo
Diarrheal waterborne diseases are caused by the consumption of pathogenic microorganisms in contaminated water (or food contaminated by water), and are thus directly or indirectly hydrologically controlled. The toll of these diseases is more than 2 million lives annually. Low-income countries and children account for most of the deaths.
Cholera, the best-known among lethal diarrheal diseases, is an infection of the small intestine caused by the bacterium Vibrio cholerae, discovered by Filippo Pacini in 1854 during an epidemic in Florence. The bacterium produces a toxin that can cause profuse diarrhea and death by dehydration. The World Health Organization has not yet released complete world statistics for 2012; for 2011, a total of 58 countries reported a cumulative total of 589,854 cases, including 7816 deaths (a case fatality rate of 1.3% and an increase of 85% over the number of reported cases for the previous year). The most recent large epidemic began in Haiti in October 2010, following the catastrophic earthquake that hit the poor Caribbean country at the beginning of 2010; the ongoing epidemic, according to the report of June 23, 2013, has claimed 8139 lives out of 661,468 recorded cases.
Efforts to understand, predict, and control epidemic outbreaks are crucial to improving the health of many people around the world. Mathematical models of epidemiology have an important role to play in achieving these goals. It was Daniel Bernoulli who, in 1760, proposed the first mathematical formulation to evaluate the effectiveness of inoculation against smallpox. Bernoulli was trained in both medicine and mathematics (a background shared by Sir Ronald Ross, recipient of the 1902 Nobel Prize in Physiology and Medicine, who developed differential equation models for malaria as a host–vector disease in 1911). Subsequently, A.G. McKendrick, another physician with a passion for mathematics, and W.O. Kermack, a biochemist, built on Ross’s theory to develop the ancestor of all modern susceptible–infectious–recovered (SIR) models. They also obtained the first epidemic threshold results, a concept further clarified by George MacDonald in 1952. Working on malaria, MacDonald defined the basic reproduction number \(R_0\) as the number of secondary cases one infectious individual, introduced into a completely susceptible population, generates on average over the course of his/her infectious period. If and only if \(R_{0} > 1\), the infection will be established in the long run.
As for cholera, the seminal model was introduced in 1979 by Capasso and Paveri-Fontana [2], who studied the most recent epidemic in Italy (in Bari, 1973, a result of contaminated shellfish consumption). Their formulation was further developed by Codeço [3], who analyzed a system of ordinary differential equations that includes, in addition to susceptibles (S) and infectious (I), the population dynamics of bacteria (B) in water reservoirs (SIB model; see Figure 1a). Until recently, mathematical models of waterborne diseases did not explicitly consider the spatial spread of pathogens that occurs primarily along hydrologic pathways, from coastal to inland regions or vice versa, and from inland epidemic sites to neighboring areas. Bertuzzo et al. were the first to integrate hydrology into epidemiologic models [1]. Another consideration is that infected individuals are often asymptomatic (as many as 80% in the case of cholera). While traveling or commuting, these individuals can spread the pathogen to communities other than those in which they were infected. Similarly, susceptible individuals can be exposed to pathogens and return as infected carriers to their home communities. The basis of our most recent analyses [4] and [5] is thus a spatially explicit nonlinear differential equation model that accounts for both the hydrologic (Figure 1b) and the human mobility networks (Figure 1c). Bacterial spread along the water network is described as a random walk on an oriented graph; human movements between communities obey a gravitation-like model.
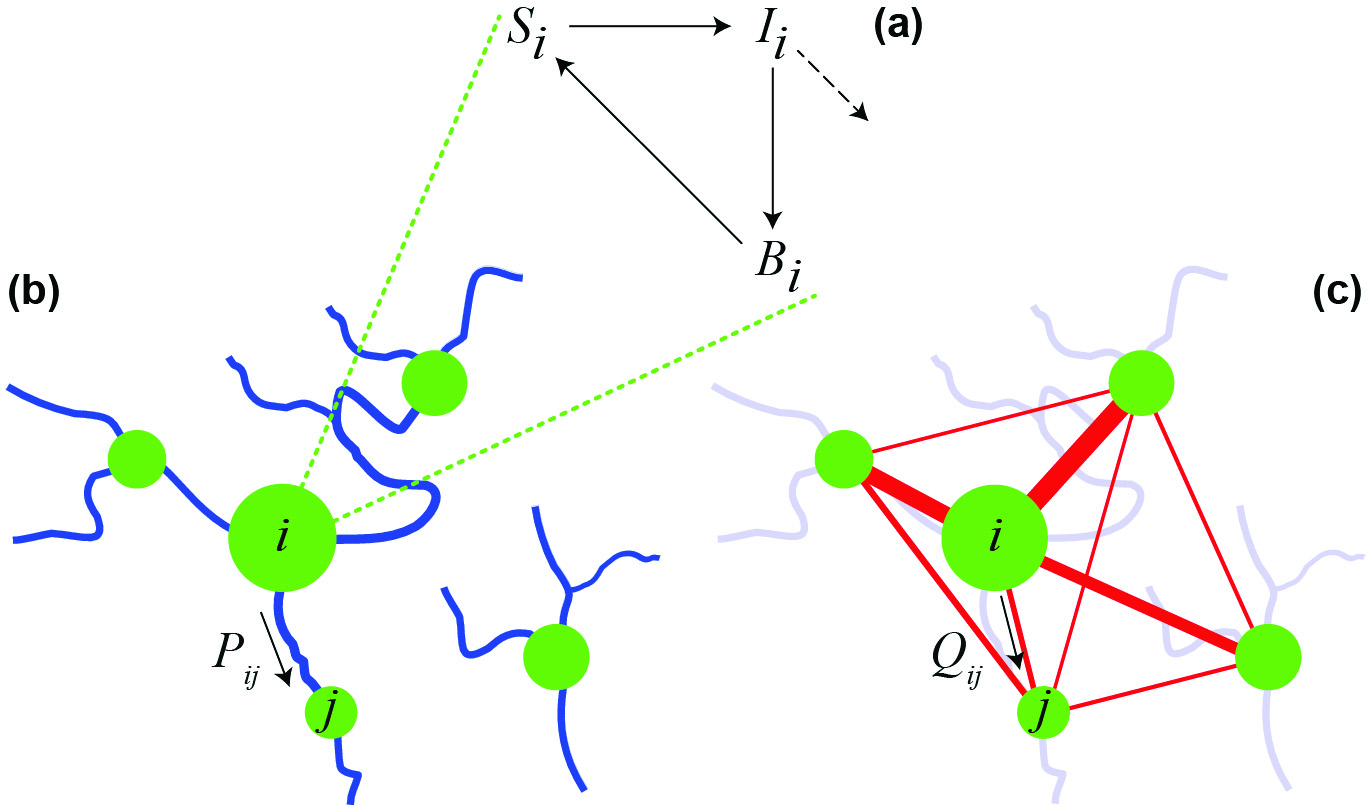
Figure 1. A spatially explicit network model for cholera epidemics. (a) Local epidemiologic dynamics in the ith community. (b) Pathogen transport along the river network. (c) Human mobility network. Communities of different sizes constitute the nodes of the network model (green circles). Connections between nodes (specified by Markov matrices P and Q) can represent hydrologic pathways and/or human displacement. Modified from [5].
|
We have studied the conditions under which a waterborne disease epidemic can start within a specific country and linked them to explicit demographic, epidemiologic, climatic, and socio-economic characteristics. We have shown that the key parameter for the spread of disease is the leading eigenvalue \(\Lambda_0\) of a generalized reproduction matrix that accounts for the spatial distribution of human communities and for the connectivity networks. If \(\Lambda_0\) is larger than 1, cholera can spread into the country; otherwise, it cannot. We note here that the condition that all the local \(R_0\)’s be larger than unity is neither necessary nor sufficient for the outbreak of an epidemic—underscoring the importance of explicit introduction of the hydrologic and human mobility connections into cholera models to determine the fate of an initial infection. We have also demonstrated that the dominant eigenvector associated with \(\Lambda_0\) can accurately describe the geography of epidemic outbreaks.
Our analysis is not only theoretical. The wide availability, via Geographic Information Systems, of spatial data on hydrology, road networks, population distribution, and sanitation makes these models applicable to the specific situations of different countries. Our network models have thus been used to study several cholera epidemics, most notably the one that continues to devastate Haiti. We have calibrated Haitian epidemiologic data for the period from November 2010 to May 2011 (Figures 2a and b); results of the analysis are shown in Figures 2c and d. In the Haitian case, \(\Lambda_0 = 1.08\): The parameter is essentially insensitive to changes in pathogen movement rate \(l\) and average mobility distance \(D\), and to increases of the human mobility rate \(m\) (Figure 2c), while it is quite sensitive to variations in the exposure and contamination rates \(\beta\) and \(p\), the pathogen mortality rate \(\mu_B\), and the recovery rate \(\gamma\). Therefore, one effective way to prevent the cholera epidemic would have been to implement sanitation measures designed to decrease the exposure (or contamination) rate by more than 40%. The dominant eigenvector is a good indicator of the spatial distribution of recorded cases (Figure 2d), as demonstrated by the corresponding coefficients of determination (see caption for Figure 2). In a sensitivity analysis run to determine how the predictive ability of the dominant eigenvector and the value of \(\Lambda_0\) change with parameter variations, the coefficients of determination exceed 75%, even for variations as high as 50%—an indication of robustness in the prediction of the spatial pattern [4].
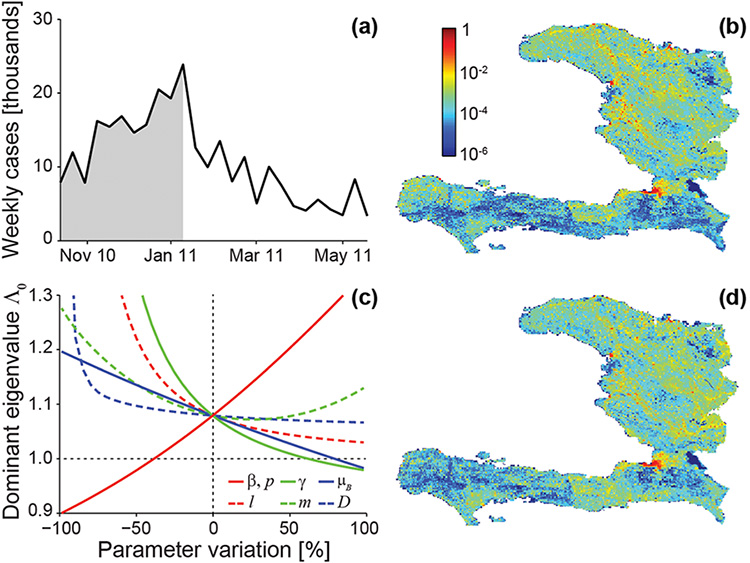
Figure 2. Data and model predictions for the Haitian epidemic. (a) Total incidence data (weekly cases) from October 2010 to June 2011. (b) Fine-grained spatial distribution of cumulative recorded cases during the outbreak phase of the epidemic (defined as the period from beginning to peak, shown in gray in panel (a); cholera cases have been normalized). (c) Sensitivity to parameter variations of \(\Lambda_0\), the dominant eigenvalue of the generalized reproduction matrix; the dotted horizontal line indicates the value below which the epidemic cannot start. (d) Fine-grained spatial distribution of cases as predicted by the dominant eigenvector; coefficients of determination for predicted vs. observed cases: \(R^2_O =\) 0.92 (outbreak phase), \(R^2_T =\) 0.95 (whole period). Parameter values are as in [5]; modified from [4].
|
References
[1] E. Bertuzzo, M. Gatto, A. Maritan, S. Azaele, I. Rodriguez-Iturbe, and A. Rinaldo, On the space–time evolution of a cholera epidemic, Water Resour. Res., 44 (2008), W01424.
[2] V. Capasso and S.L. Paveri-Fontana, A mathematical model for the 1973 cholera epidemic in the European Mediterranean region, Rev. Epidemiol. Santé Publique, 27 (1979), 121–132.
[3] C. Codeço, Endemic and epidemic dynamics of cholera: The role of the aquatic reservoir, BMC Infect. Dis., 1:1 (2001).
[4] M. Gatto, L. Mari, E. Bertuzzo, R. Casagrandi, L. Righetto, I. Rodriguez-Iturbe, and A. Rinaldo, Generalized reproduction numbers and the prediction of patterns in waterborne disease, Proc. Natl. Acad. Sci. USA, 48 (2012), 19703–19708.
[5] A. Rinaldo, E. Bertuzzo, L. Mari, L. Righetto, M. Blokesch, M. Gatto, R. Casagrandi, M. Murray, S. Vesenbeckh, and I. Rodriguez-Iturbe, Reassessment of the 2010–2011 Haiti cholera outbreak and rainfall-driven multiseason projections, Proc. Natl. Acad. Sci. USA, 109 (2012), 6602–6607.
Lorenzo Mari is a postdoc in the Ecology Group at Politecnico di Milano, where Marino Gatto is a professor. Andrea Rinaldo is a professor of hydrology at Ecole Polytechnique Fédérale de Lausanne and Università degli Studi di Padova.